EEMS has a feature that allows users to extract flow flux through a flux line (a cross-section) and compare the extracted flow to the measured flow. This blog will show you how to create a flux line, extract flow flux from the model results, and then compare the model flow to measured flow in EEMS.
Suppose we have a time series of flow data obtained from flow stations in our model domain, and the EFDC+ model has been run and has output. We will compare the simulated/modeled flow to the measured flow at the location of the flow station.
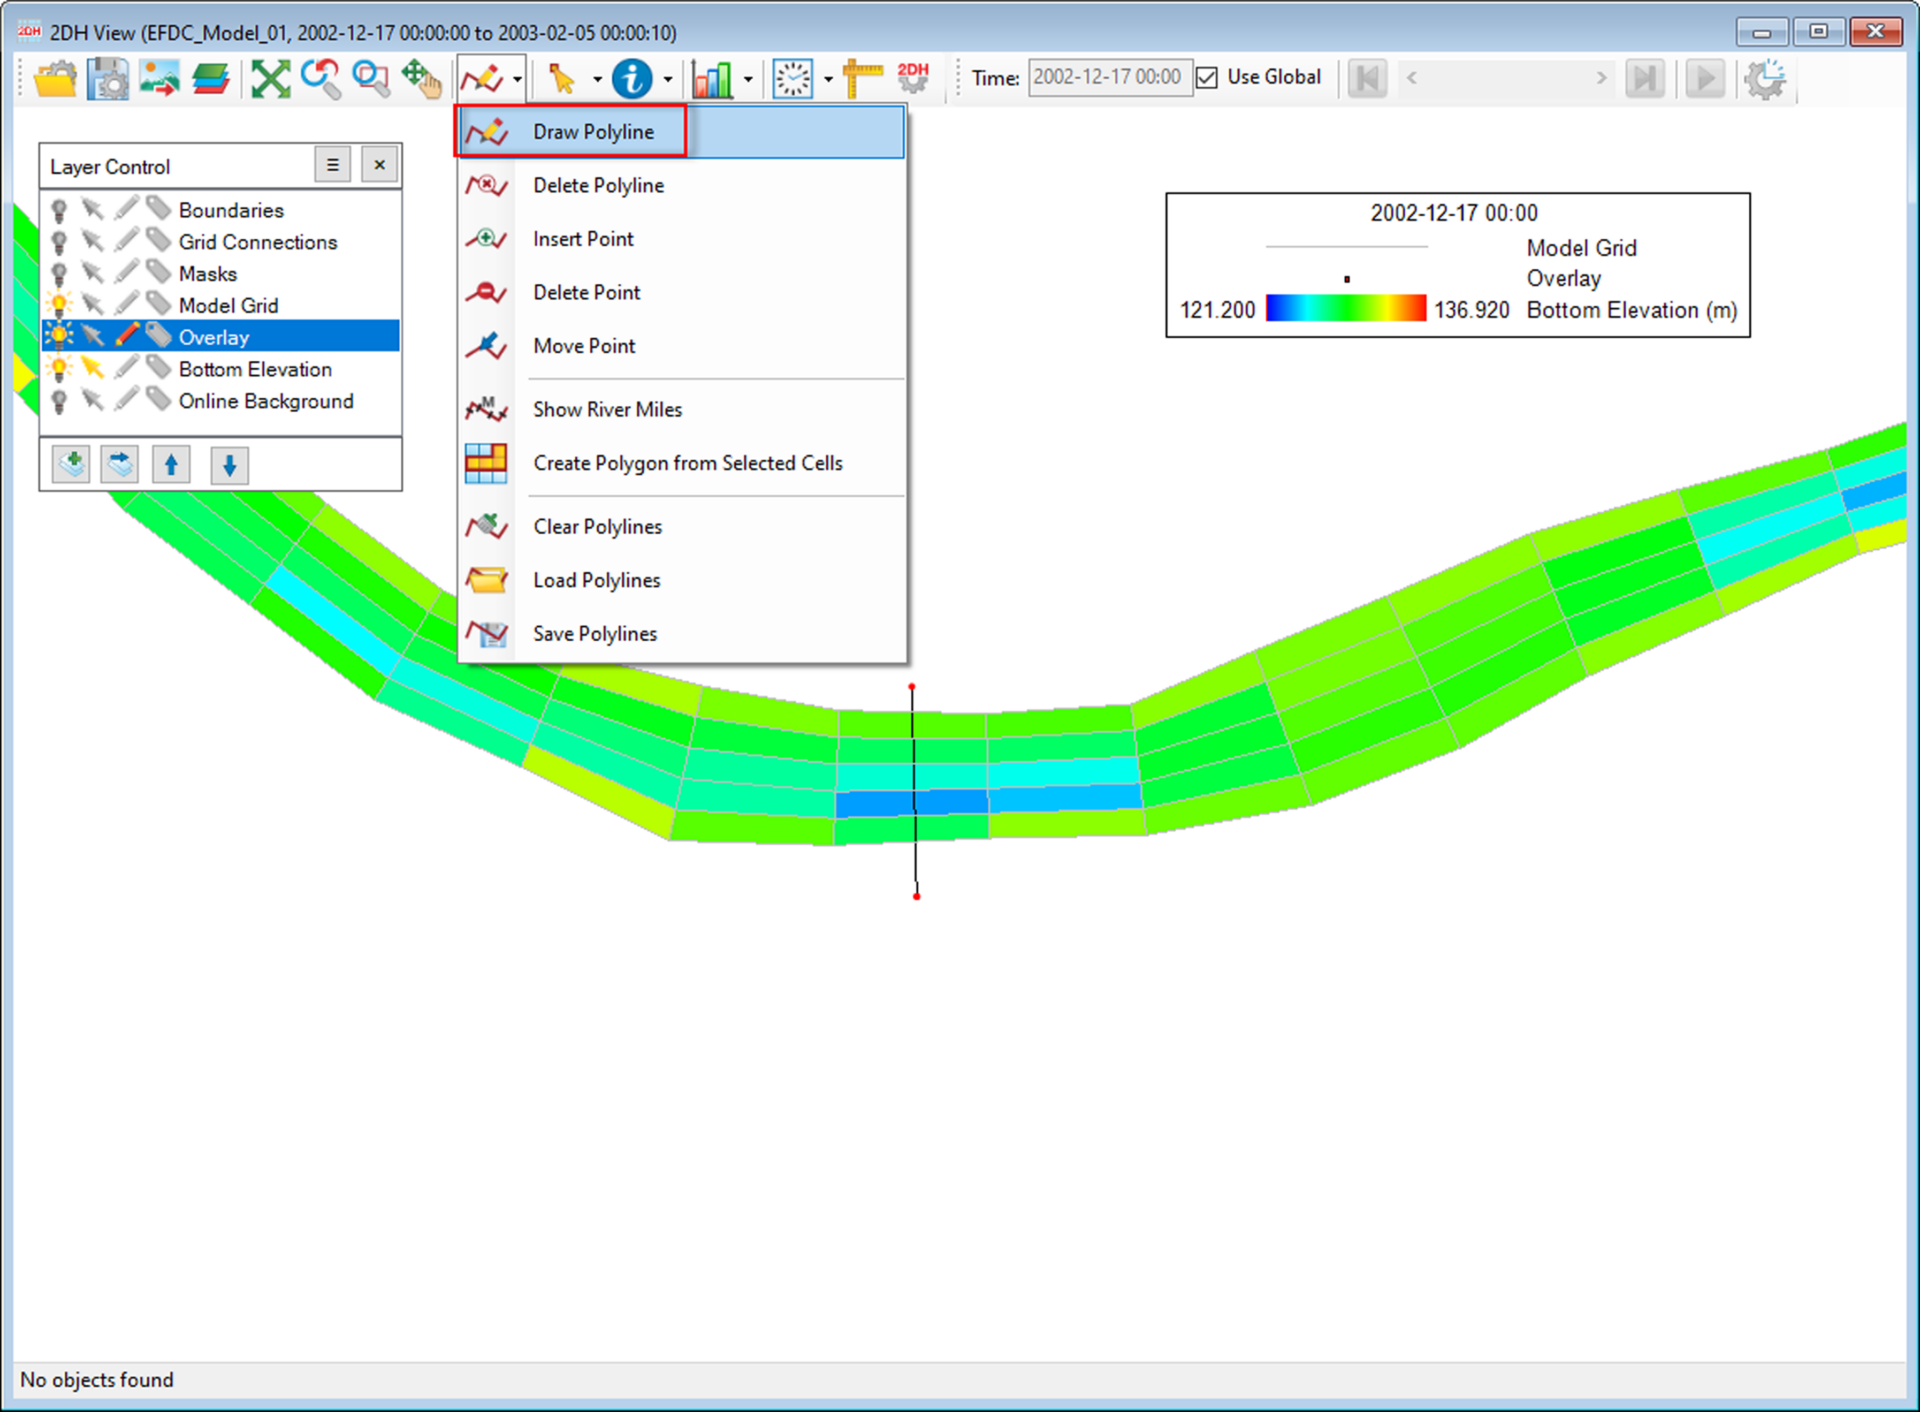
Initially, we need to create a flux line (a cross-section) near the flow station on the model domain. Go to the 2DH View and select Draw Polyline from the Poly Tool. Left-mouse click (LMC) to start drawing the line from one side to the other side of the river, then right-mouse click (RMC) to finish the drawing. As a result, an Overlay layer will be added to the Layer Control, as shown in Figure 1 below.
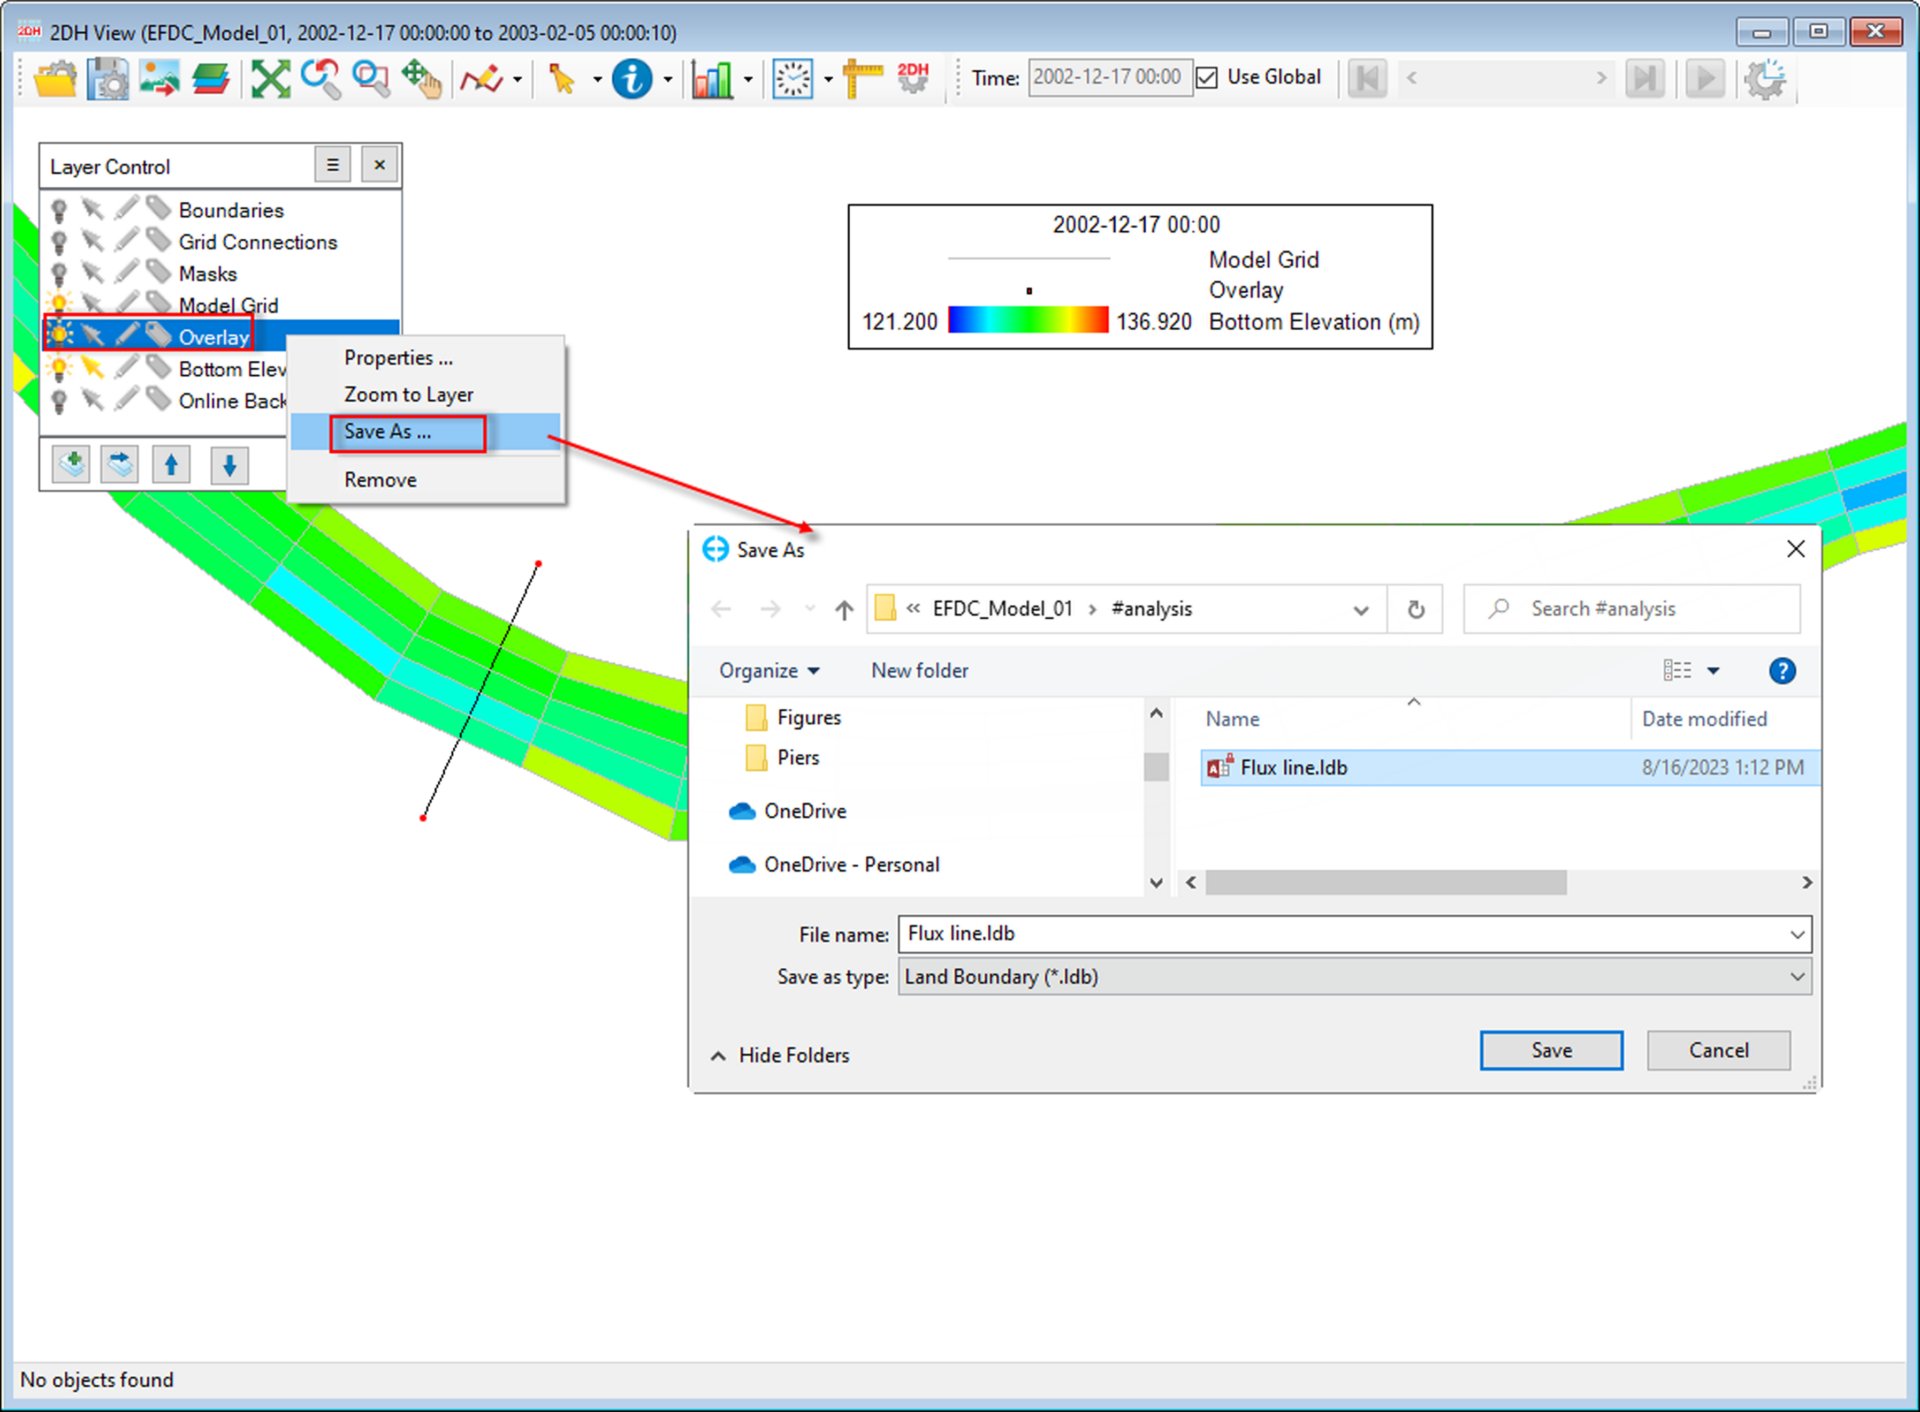
We will need to save the flux line to a file. RMC on the Overlay layer in the Layer Control form, then select Save As, and the Save As window will be displayed. Enter a filename (e.g., flux line) and choose Land Boundary for the file type, as shown in Figure 2.
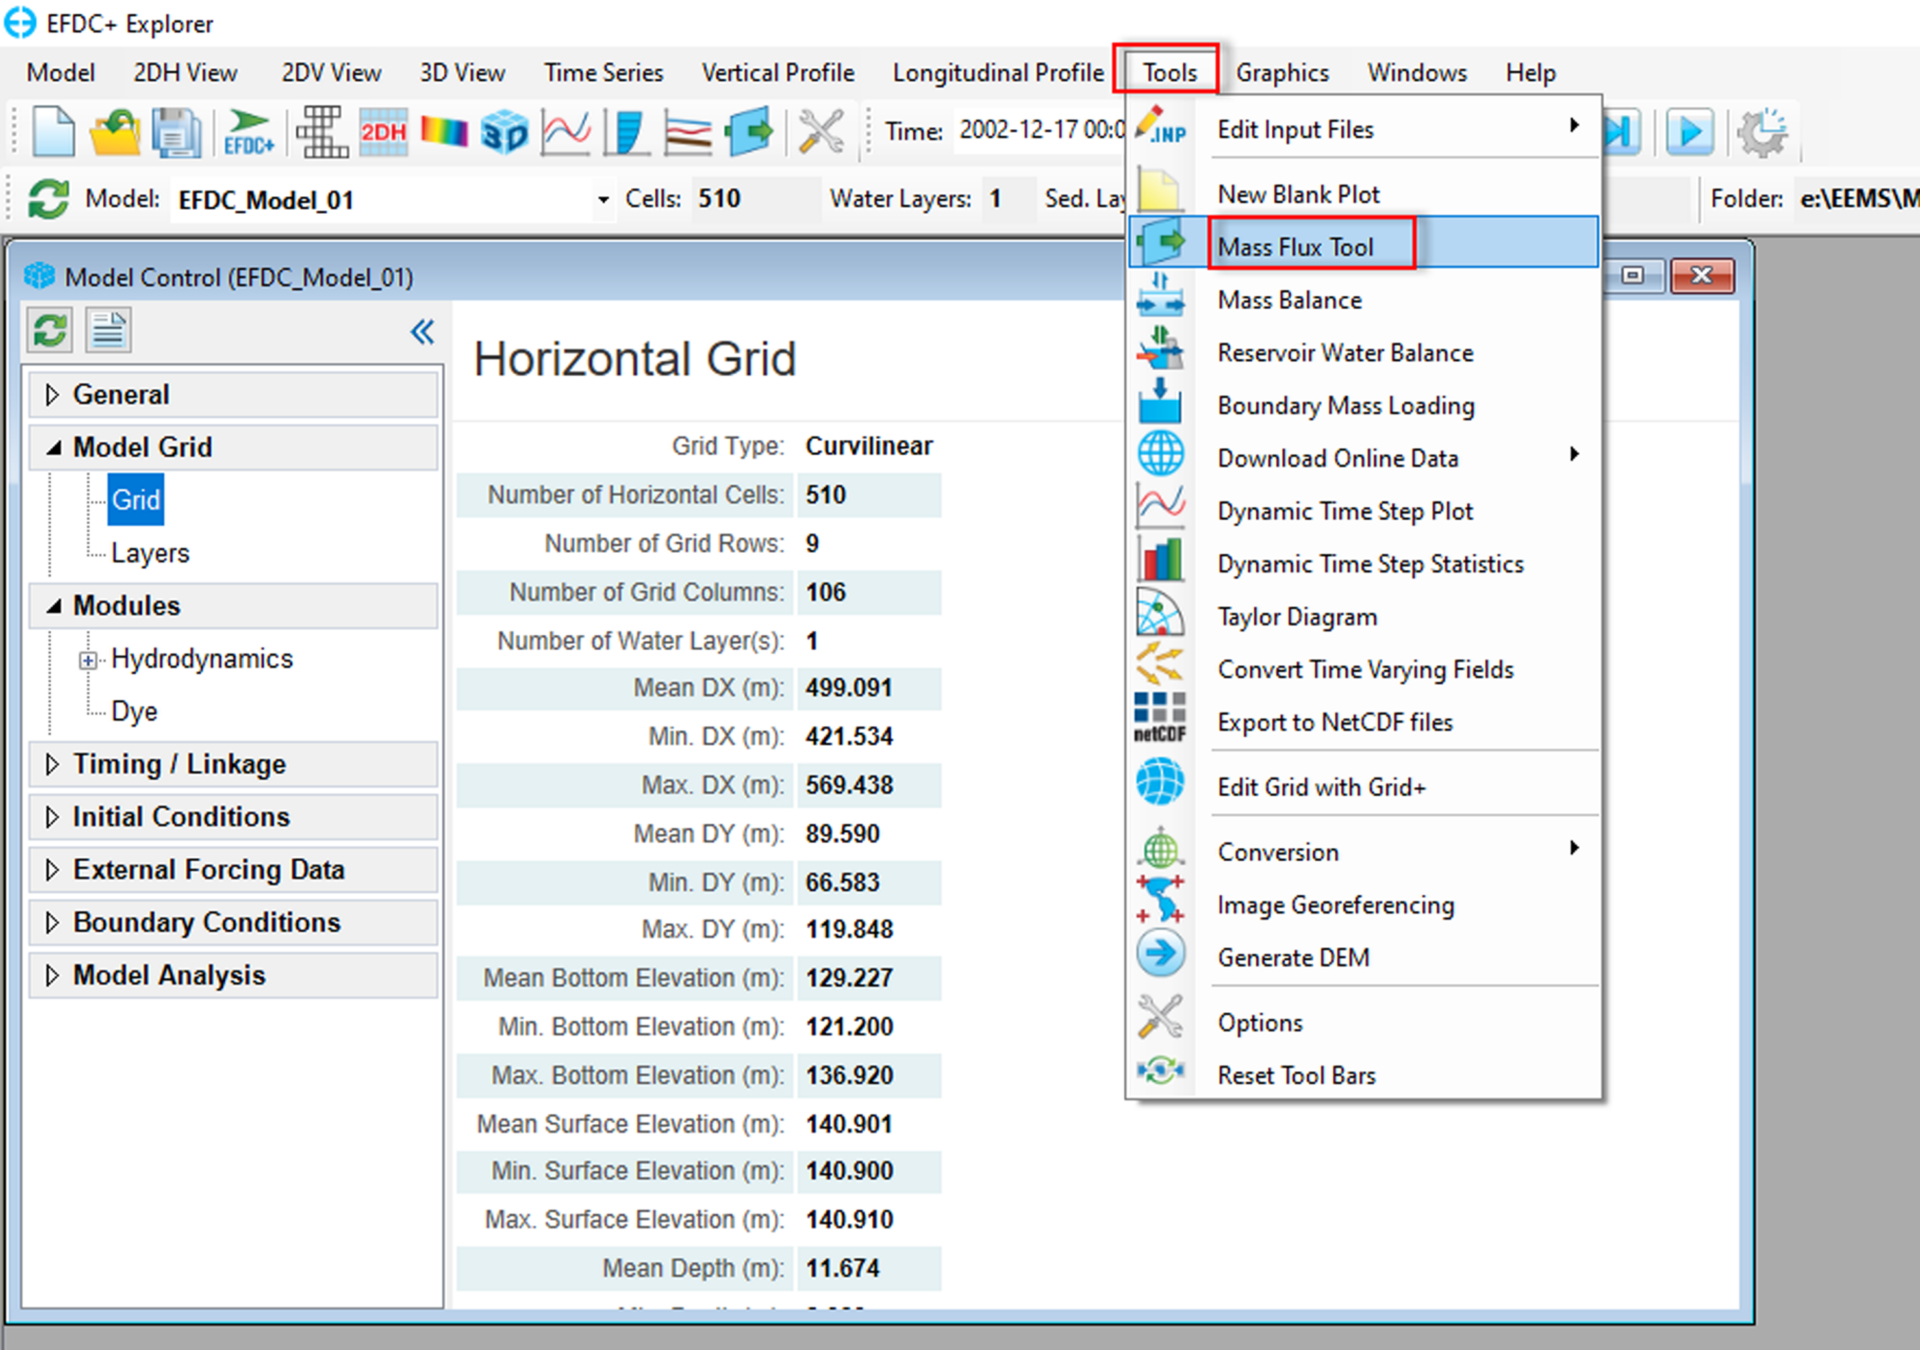
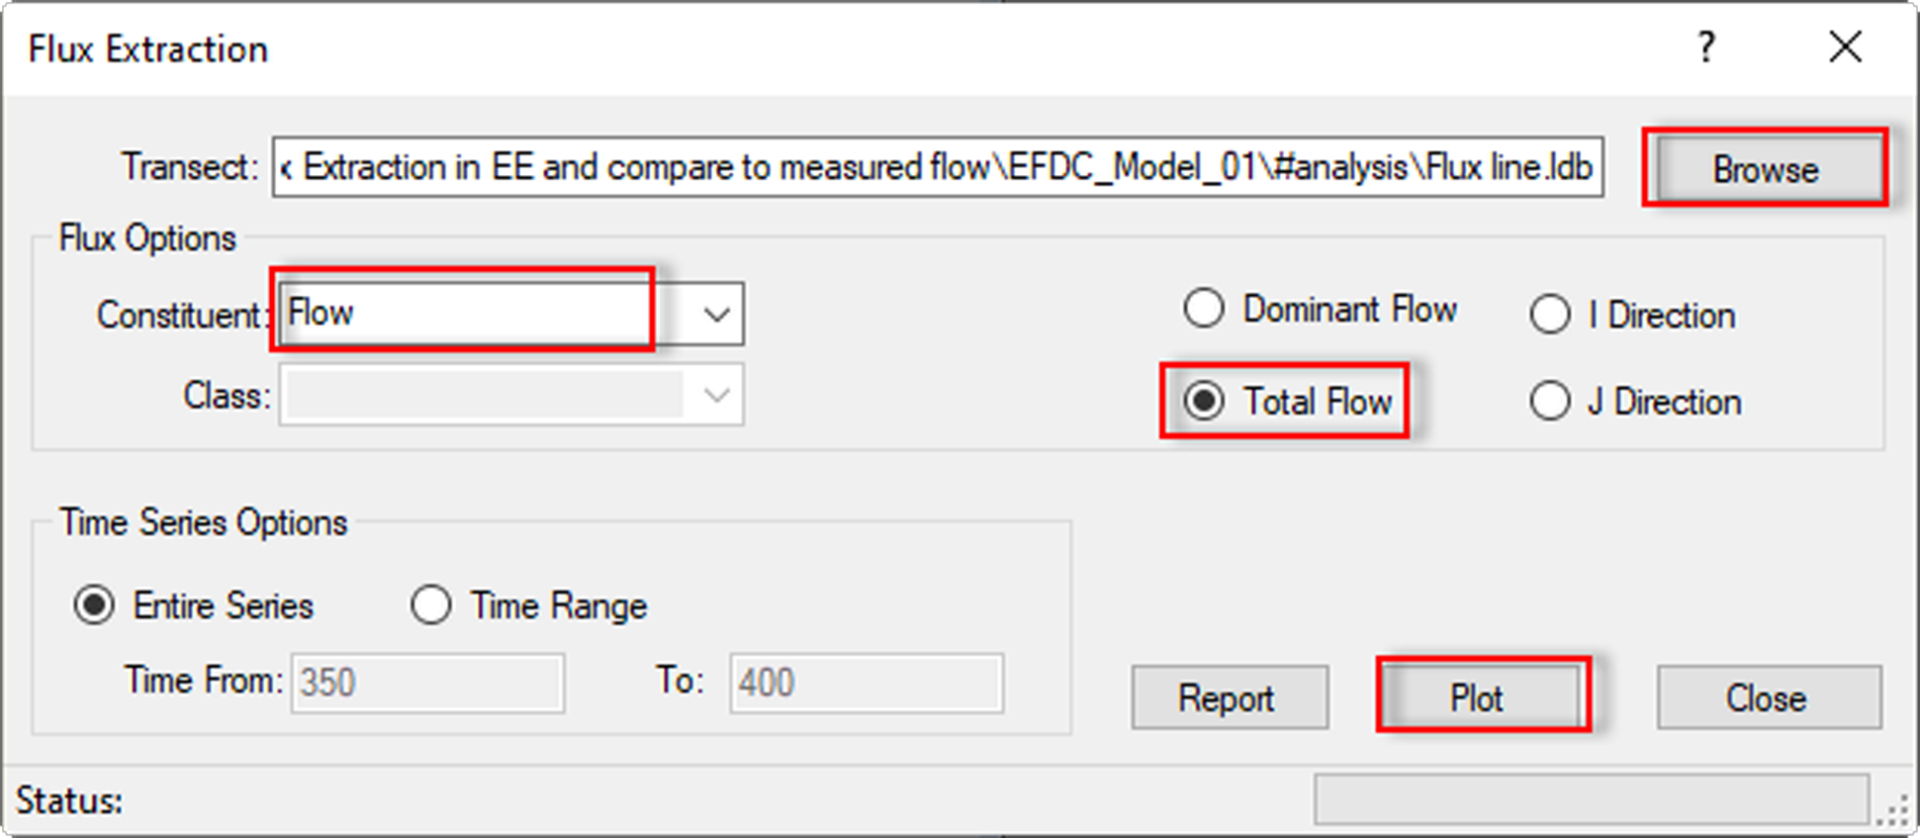
Next, go to the Tools menu, then select Mass Flux Tool, as shown in Figure 3. The Flux Extraction form will be displayed as shown in Figure 4. Browse to the flux line, then select Flow for the Constituent and the Total Flow, and click the Plot button (Figure 4).
The Time Series Options allow setting the time frame of flow time series extracted from the model output. EE will take the model timing frame as the default, with time in Julian days. We can shorten the time frame by selecting the Time Range option.
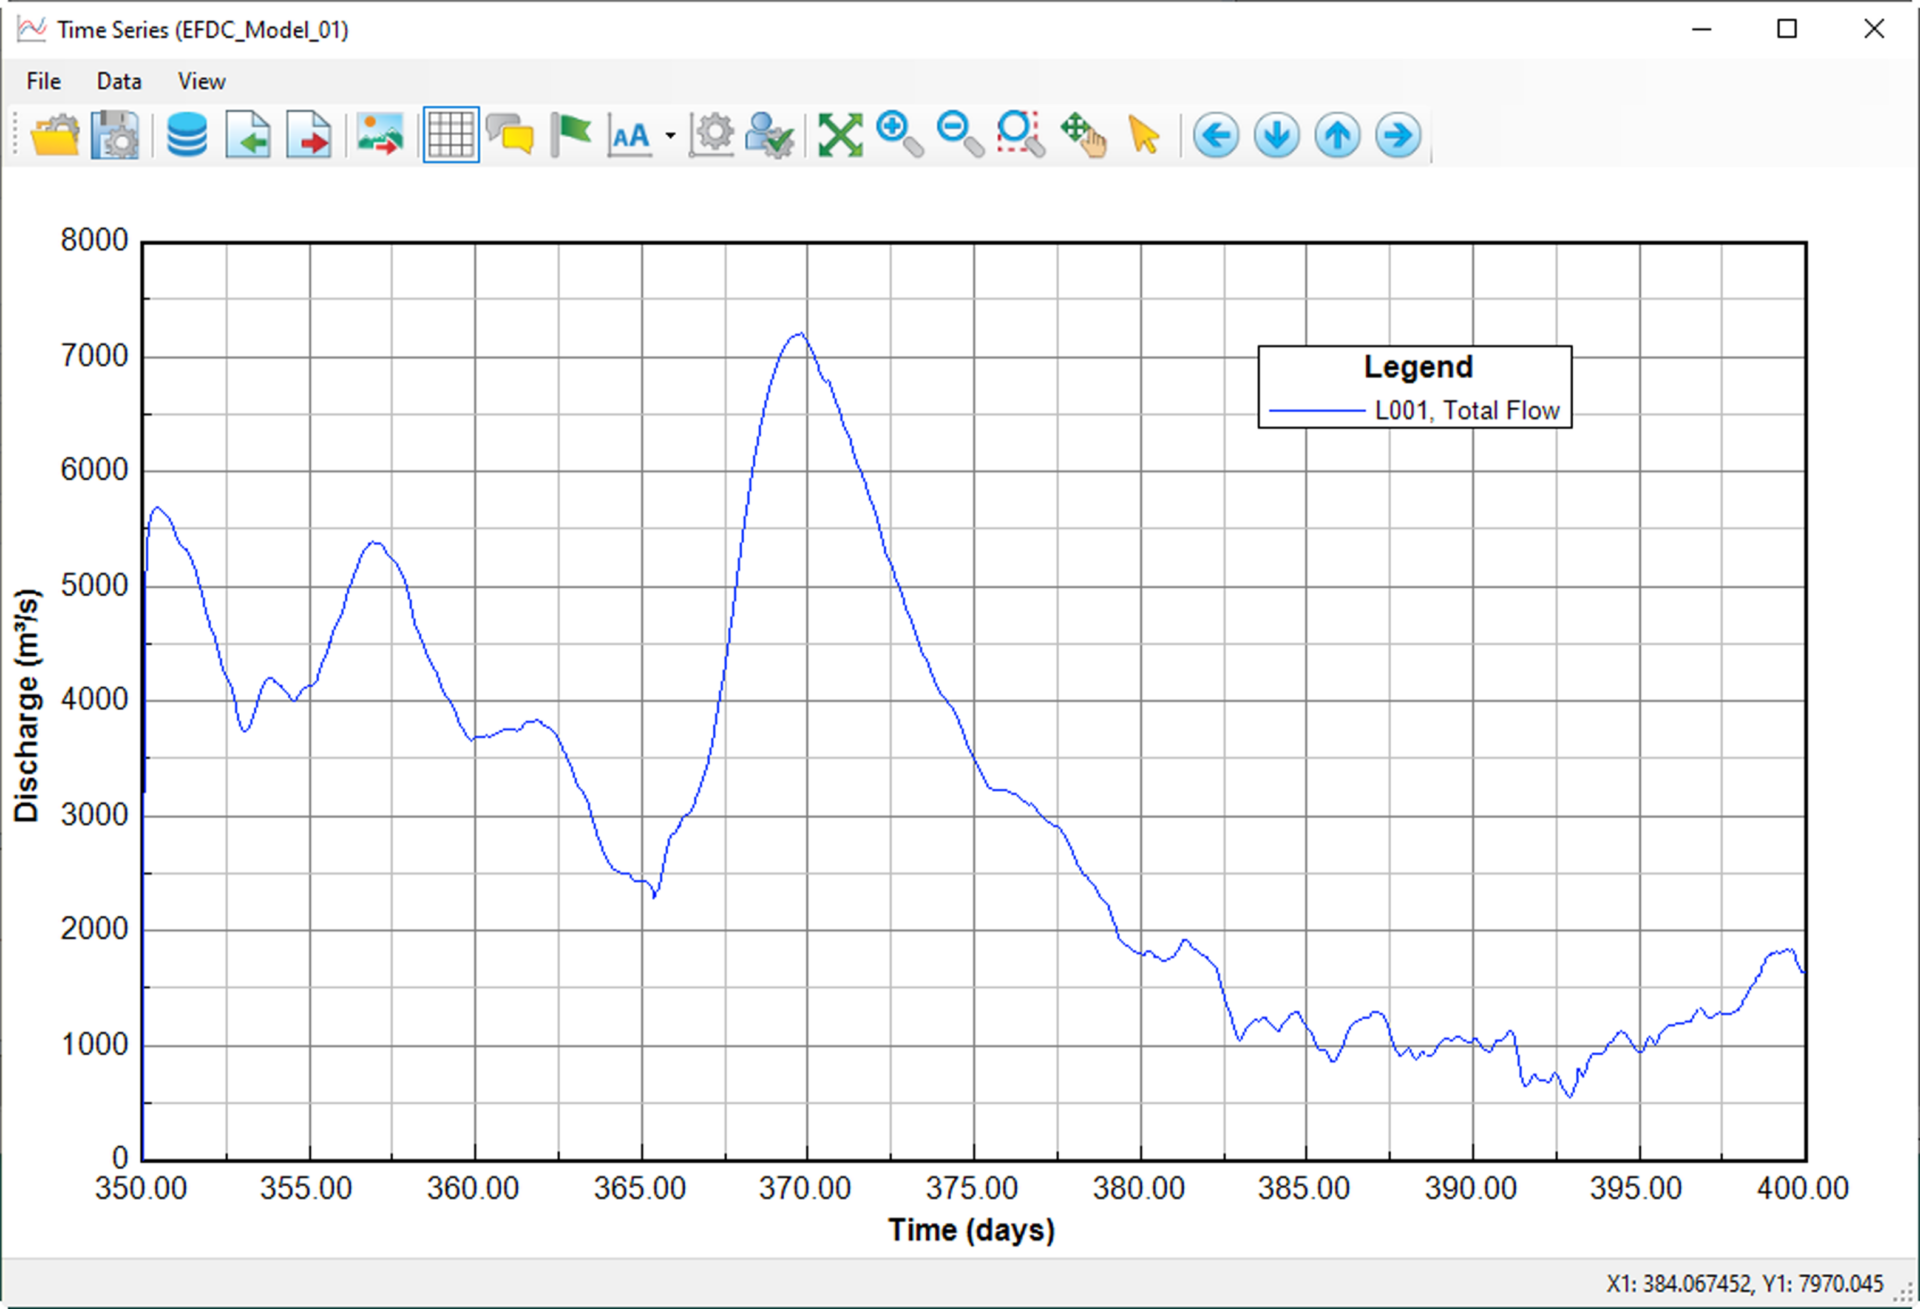
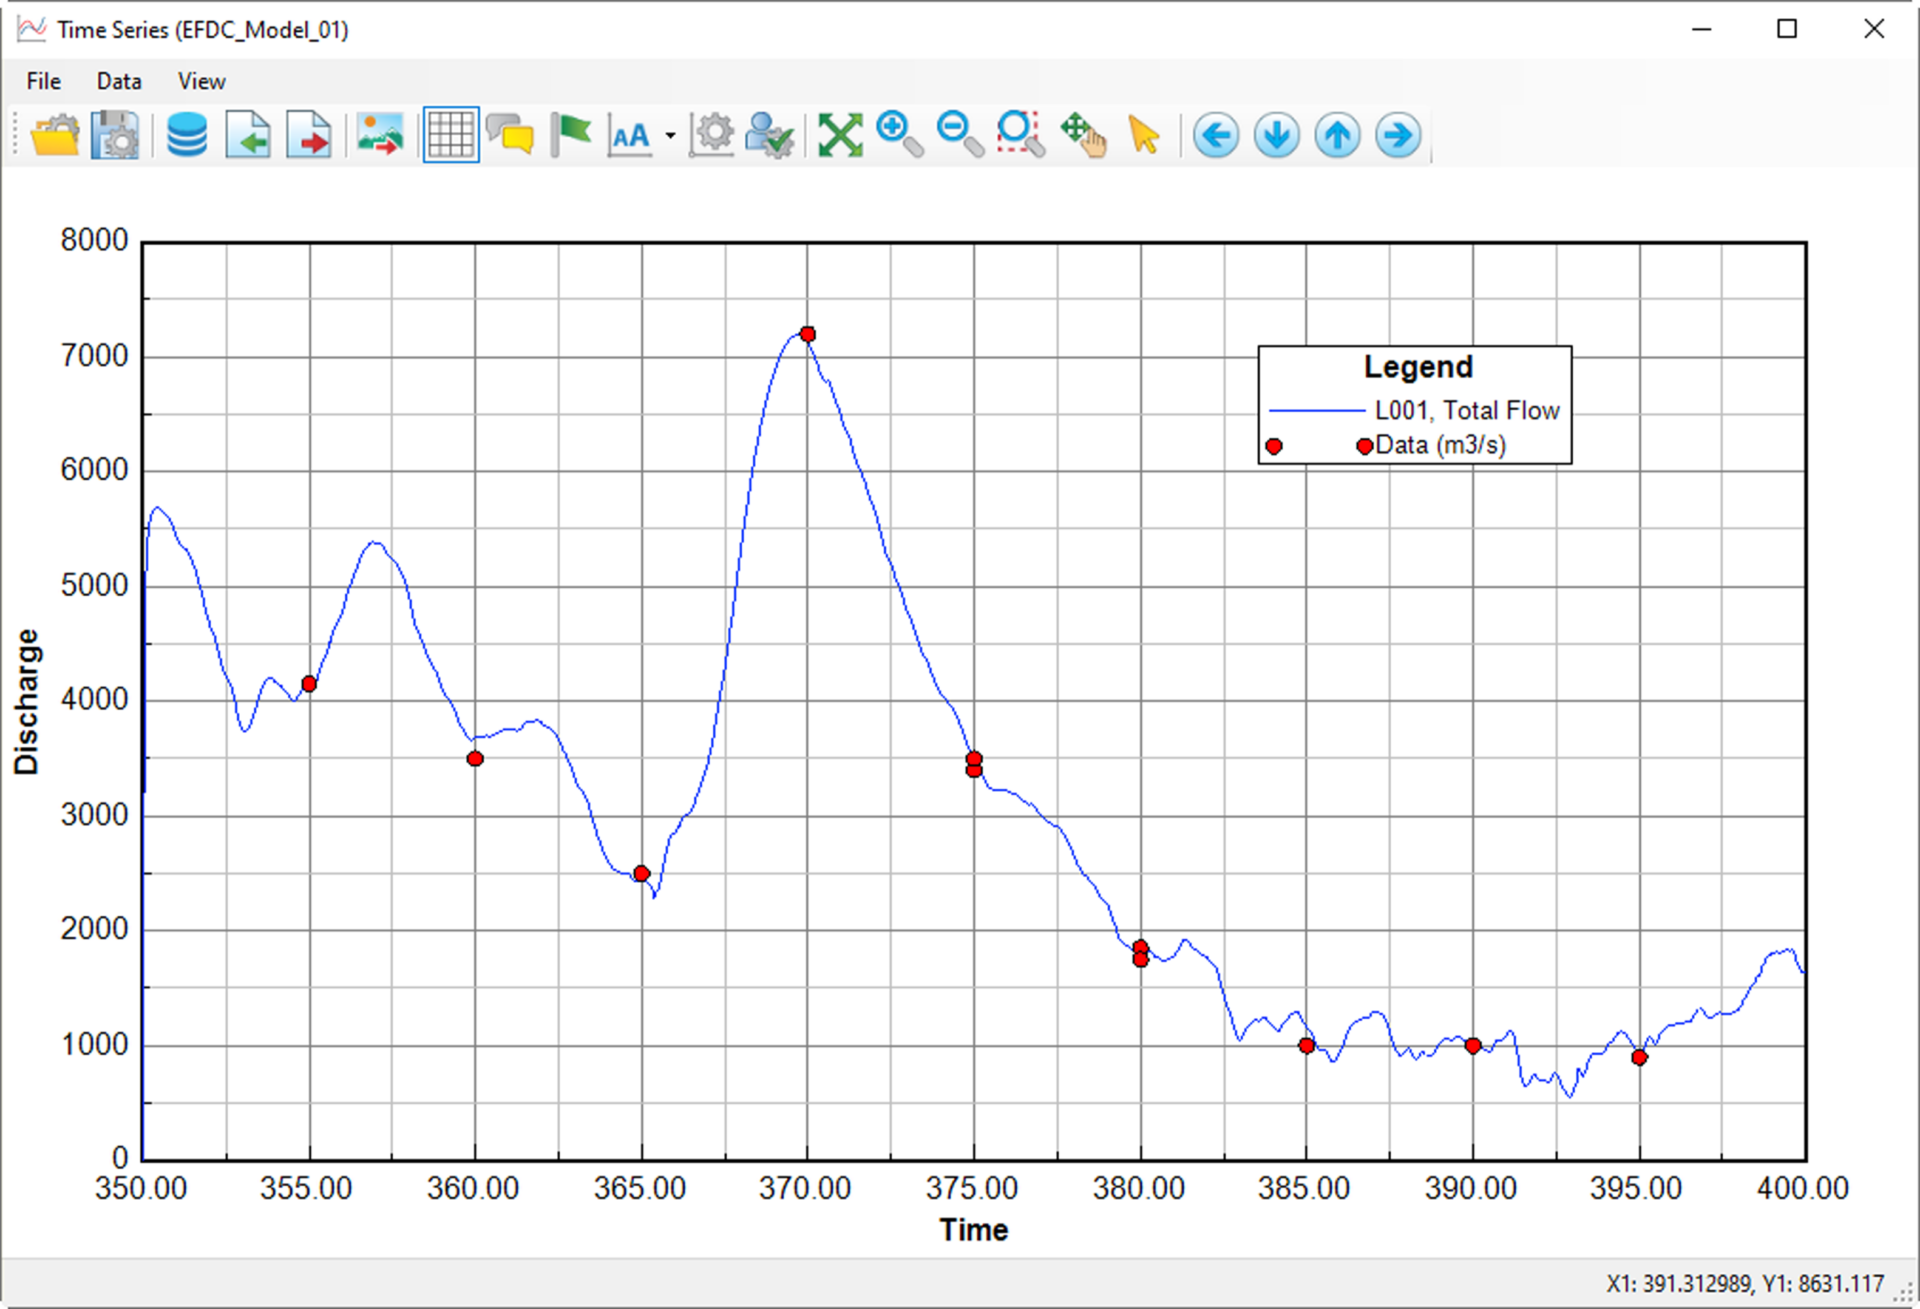
After clicking the Plot button, the time series of flux flow extracted from the model will be displayed as shown in Figure 5. Now, we will import the measured flow data into the plot to compare with the model, as shown in Figure 6.
