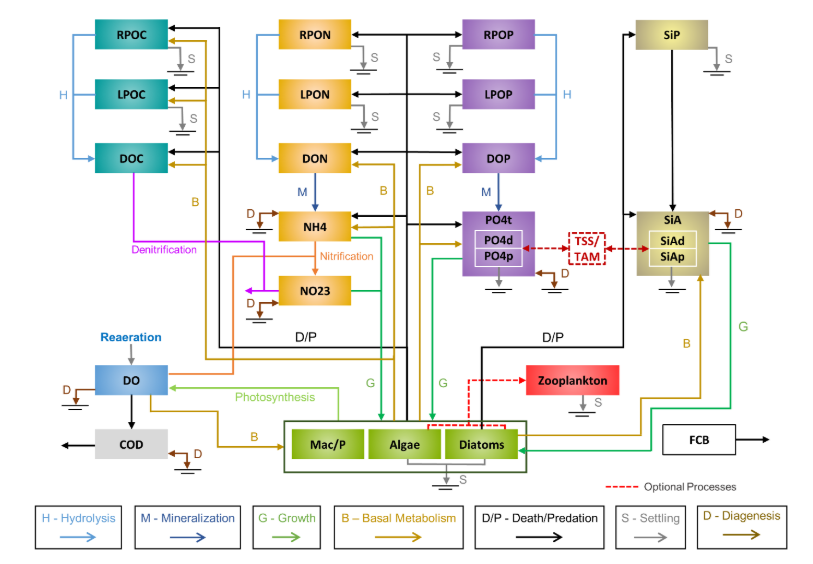
In EFDC+, the eutrophication module refers to modeling aquatic plants and algae, zooplankton, and the biochemical transformation of nutrients during this process. The kinetic processes included in the EFDC+ eutrophication module are derived from the CE-QUAL-ICM (or ICM) water quality model. This blog post describes significant changes in this module that include bug fixes and new features.
The schematic representation of the coupling between the water quality components is shown in Figure 1 (adapted from ICM). The complete set of state variables in the EFDC+ water quality module is provided in Table 1. In a recent code review, we discovered that in EFDC+ 10.3 and before:
- RPOC did not hydrolyze to DOC, and it consumed DOX as a function of the hydrolysis rate.
- RPOP did not hydrolyze to DOP, instead it converted directly to PO4t;
- RPON did not hydrolyze to DON, instead it converted directly to NH3;

For consistency with the EFDC theory, the hydrolysis process was updated in EFDC+ 10.4, as shown in Figure 1. As a result, the users may obtain different results of some organic components compared to EFDC+ 10.3 as higher concentrations of DOC, DOP, DON, DOX, and lower concentrations of PO4t and NH3 are expected.
| # | Water quality state variable | Acronyms | Units | Group |
|---|---|---|---|---|
| 1 | Refractory particulate organic carbon | RPOC | mg/L | Row 1 |
| 2 | Labile particulate organic carbon | LPOC | mg/L | |
| 3 | Dissolved organic carbon | DOC | mg/L | |
| 4 | Refractory particulate organic phosphorus | RPOP | mg/L | Phosphorus |
| 5 | Labile particulate organic phosphorus | LPOP | mg/L | |
| 6 | Dissolved organic phosphorus | DOP | mg/L | |
| 7 | Total phosphate | PO4t | mg/L | |
| 8 | Refractory particulate organic nitrogen | RPON | mg/L | Nitrogen |
| 9 | Labile particulate organic nitrogen | LPON | mg/L | |
| 10 | Dissolved organic nitrogen | DON | mg/L | |
| 11 | Ammonium | NH4 | mg/L | |
| 12 | Nitrate and Nitrite | NO3+, NO2+ | mg/L | |
| 13 | Particulate biogenic silica | Si | mg/L | Silica |
| 14 | Dissolved available silica | SiA | mg/L | |
| 15 | Chemical oxygen demand | COD | mg/L | Others |
| 16 | Dissolved oxygen | DO | mg/L | |
| 17 | Total active metals | TAM | mole/m^3 | |
| 18 | Fecal coliform bacteria | FCB | M P N/100 ml | |
| 19 | Carbon dioxide | CO2 | mg/l C | |
| 20 | Aquatic plants | Ba | mg/l C | Algae and Macrophytes |
| 21 | Aquatic animals | Zz | mg/l C | Zooplankton |
Table 1: EFDC+ model water quality state variables
Other than the hydrolysis process, we also discovered that in EFDC+ 10.3 and earlier releases, PO4t production from mineralization of DOP was being done at a reduced rate (half than usual). The reduced rate occurred as the constituent concentration from the current time-step was not being added. This issue can lead to a less than expected PO4t concentration and further affect overall biota growth within the model system.
Finally, in EFDC+ 10.3 and earlier releases, if a constituent enters a cell when it is dry, the settling is ignored as a loss term until either the cell becomes wet or the particulates are advected out of the cell. This issue may cause a reduction in the total amount of constituent entering the system. The EFDC + 10.4 has been updated to handle the settling for particulate matter for dry cells that still have inflow.
All mentioned bugs are inherited from the earliest version of publicly available EFDC code in 2004. One of the subroutines, WQSKE1,* contained the bugs, and subsequent EFDC codes derived from that source carried forward the bugs. These bugs were not found until DSI was upgrading the code from the original ICM kinetics to the latest EFDC+ 10.4, where we increased the capability of simulating three biota groups to unlimited biota groups.
During our testing, the impact of these bug fixes varies by the water body, and we have listed out some specific cases in which the effect of these bugs may be noticeable.
- Smaller lakes or ponds with high residence times,
- Models where phosphorus is limiting the biota production, and
- Models with large amounts of wetting and drying cells and the boundary conditions input nutrients to the cells that routinely dry.
A dynamic water body, such as a river section, will exhibit less effect from these bugs. We recommend users run the existing model with the latest EFDC+ 10.4 and compare results with the previous model run, then make necessary parameter adjustments.
In addition to these crucial bug-fixes in the latest EFDC+ 10.4, we added new features as listed below,
- User-specified depth range for macrophyte growth. In EFDC+ 10.3, the macrophyte growth is restricted to layer 1, the bottom-most water column layer in a multi-layer model. In EFDC+ 10.4, users can set the growth depth range, and macrophytes can grow through multiple layers.
- Rising/Buoyant behavior for phytoplankton. In EFDC+ 10.3, users can specify the settling velocity, and the vertical movement is dependent on the hydrodynamics. In EFDC+ 10.4, phytoplankton may rise up due to buoyant forces, if needed.
- Light extinction due to self-shading by macrophytes. This is a new feature added to EFDC+ 10.4 to simulate the increased light shading caused by the increase in biota concentration in the water column. The default value is 0.01 in EFDC+ 10.4, which can lead to a lower simulated biota concentration than EFDC+ 10.3. Changing the value to 0 disables this feature.
We constantly strive to improve EFDC+ and describe any code changes to our users. EFDC+ is now open-source, and you can view the changes in the code yourself. We would like to acknowledge the collaboration and contribution of professor Dongil Seo from Chungnam National University, South Korea in the improvement of the phytoplankton/zooplankton dynamics.
- In the legacy EFDC version, the file is WQSKE1.F90. From EFDC 10.3, the WQSKE1 subroutine is put in mod_wq.f90 *
For more information on the EFDC models and what EFDC+ can do for you, contact the DSI team today.


