EFDC+
Eutrophication and Water Quality
What EFDC+ adds to the legacy EFDC code
Convention: [EFDC+] marks a capability not present in the legacy EPA/GVC code.
Human activities increase the level of nutrients in surface water bodies, leading to severe algal blooms, lowering dissolved oxygen, and often killing fish and other organisms. To better understand the impacts of numerous factors on your ecosystem and support informed decisions for mitigation, EFDC+ provides you with a range of tools from simple to complex, all in one coupled model.
The CE-QUAL-ICM kinetics and the sediment diagenesis model are inherited from the original code. [EFDC+] What EFDC+ adds is room to move: the ICM kinetics have been rewritten for unlimited phytoplankton, periphyton, and macrophyte classes, zooplankton has been integrated into algal dynamics, and cyanobacteria can now migrate vertically, which is the mechanism behind harmful algal blooms.
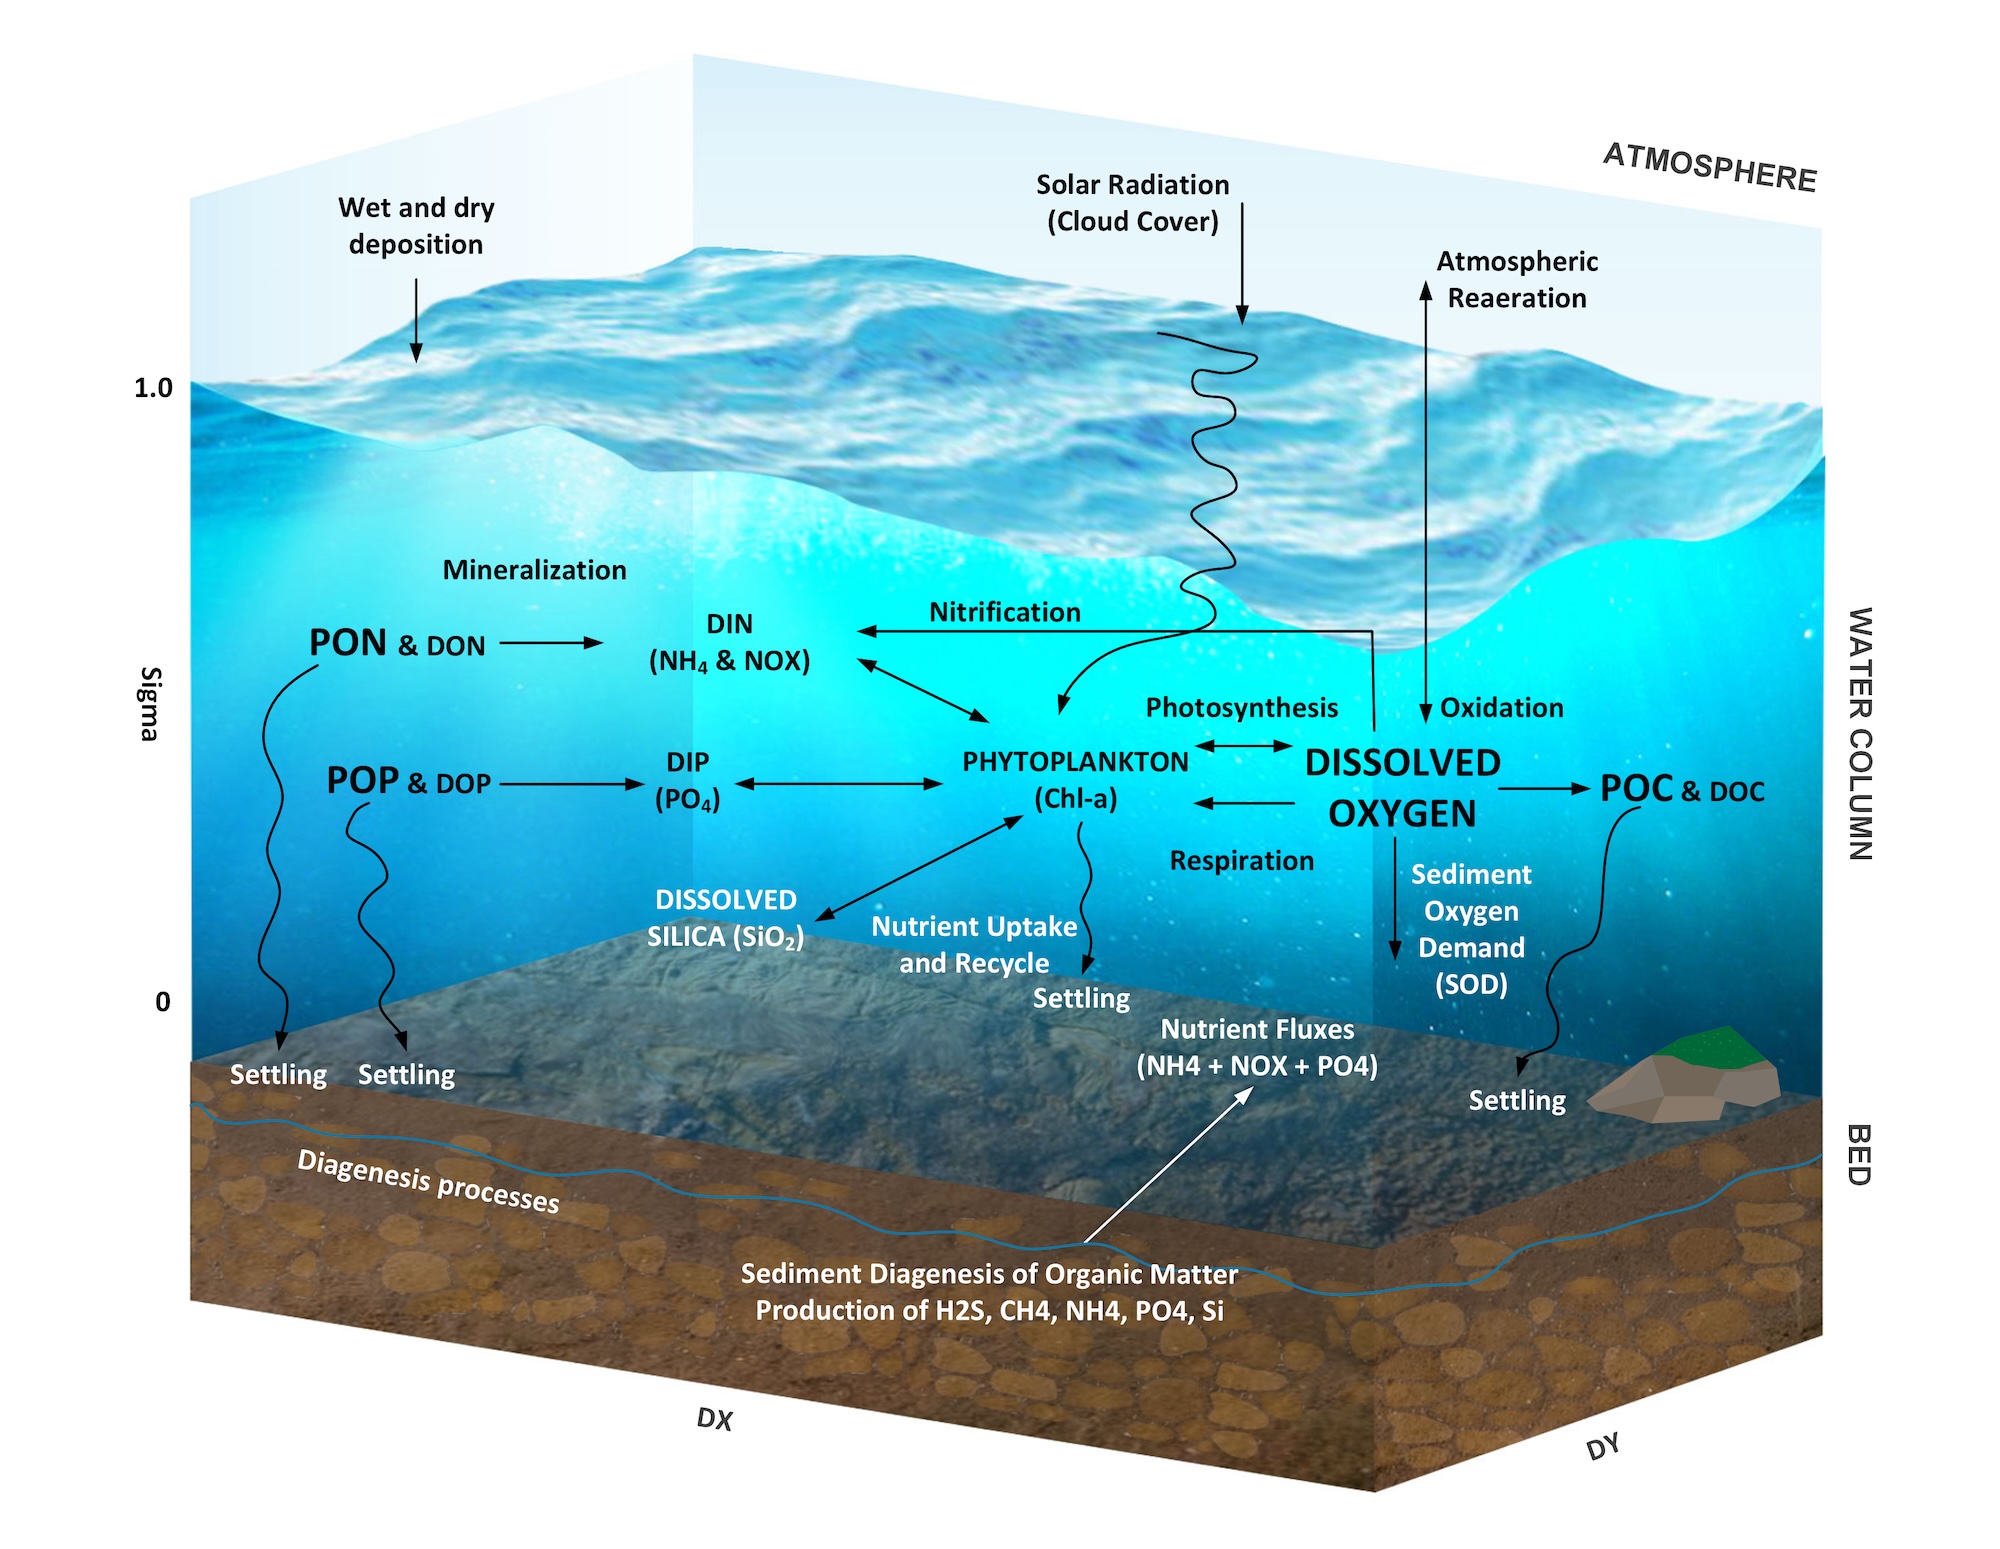
Figure 1 — Water quality conceptual framework
What EFDC+ Adds
| Capability | Legacy EFDC (EPA/GVC) | EFDC+ |
|---|---|---|
| Algal groups | Three fixed groups plus one macroalgae group | Unlimited phytoplankton, periphyton, and macrophyte classes |
| Zooplankton | Not available | Unlimited groups, integrated into algal dynamics |
| Algal vertical migration | Not available | Two models — predefined and dynamic velocity (EFDC+ 12) |
| Macrophyte placement | Stationary, fixed | Grows between layers, base in any layer, resists flow |
| Carbon dioxide | Not available | Simulated as a state variable |
| Kinetic time step | Not available | Separate kinetic time step can be specified |
Full Eutrophication Module
EFDC+ includes a complete eutrophication module built on the CE-QUAL-ICM framework, simulating spatial and temporal distributions across 21 state variables: three organic carbon forms, four phosphorus, five nitrogen, two silica, chemical oxygen demand, dissolved oxygen, total active metals, fecal coliform bacteria, carbon dioxide, plus unlimited aquatic plant and zooplankton groups.
You are not obliged to use all of it. Constituents can be activated selectively, so the same module serves a simple dissolved oxygen study and a full multi-group eutrophication investigation.
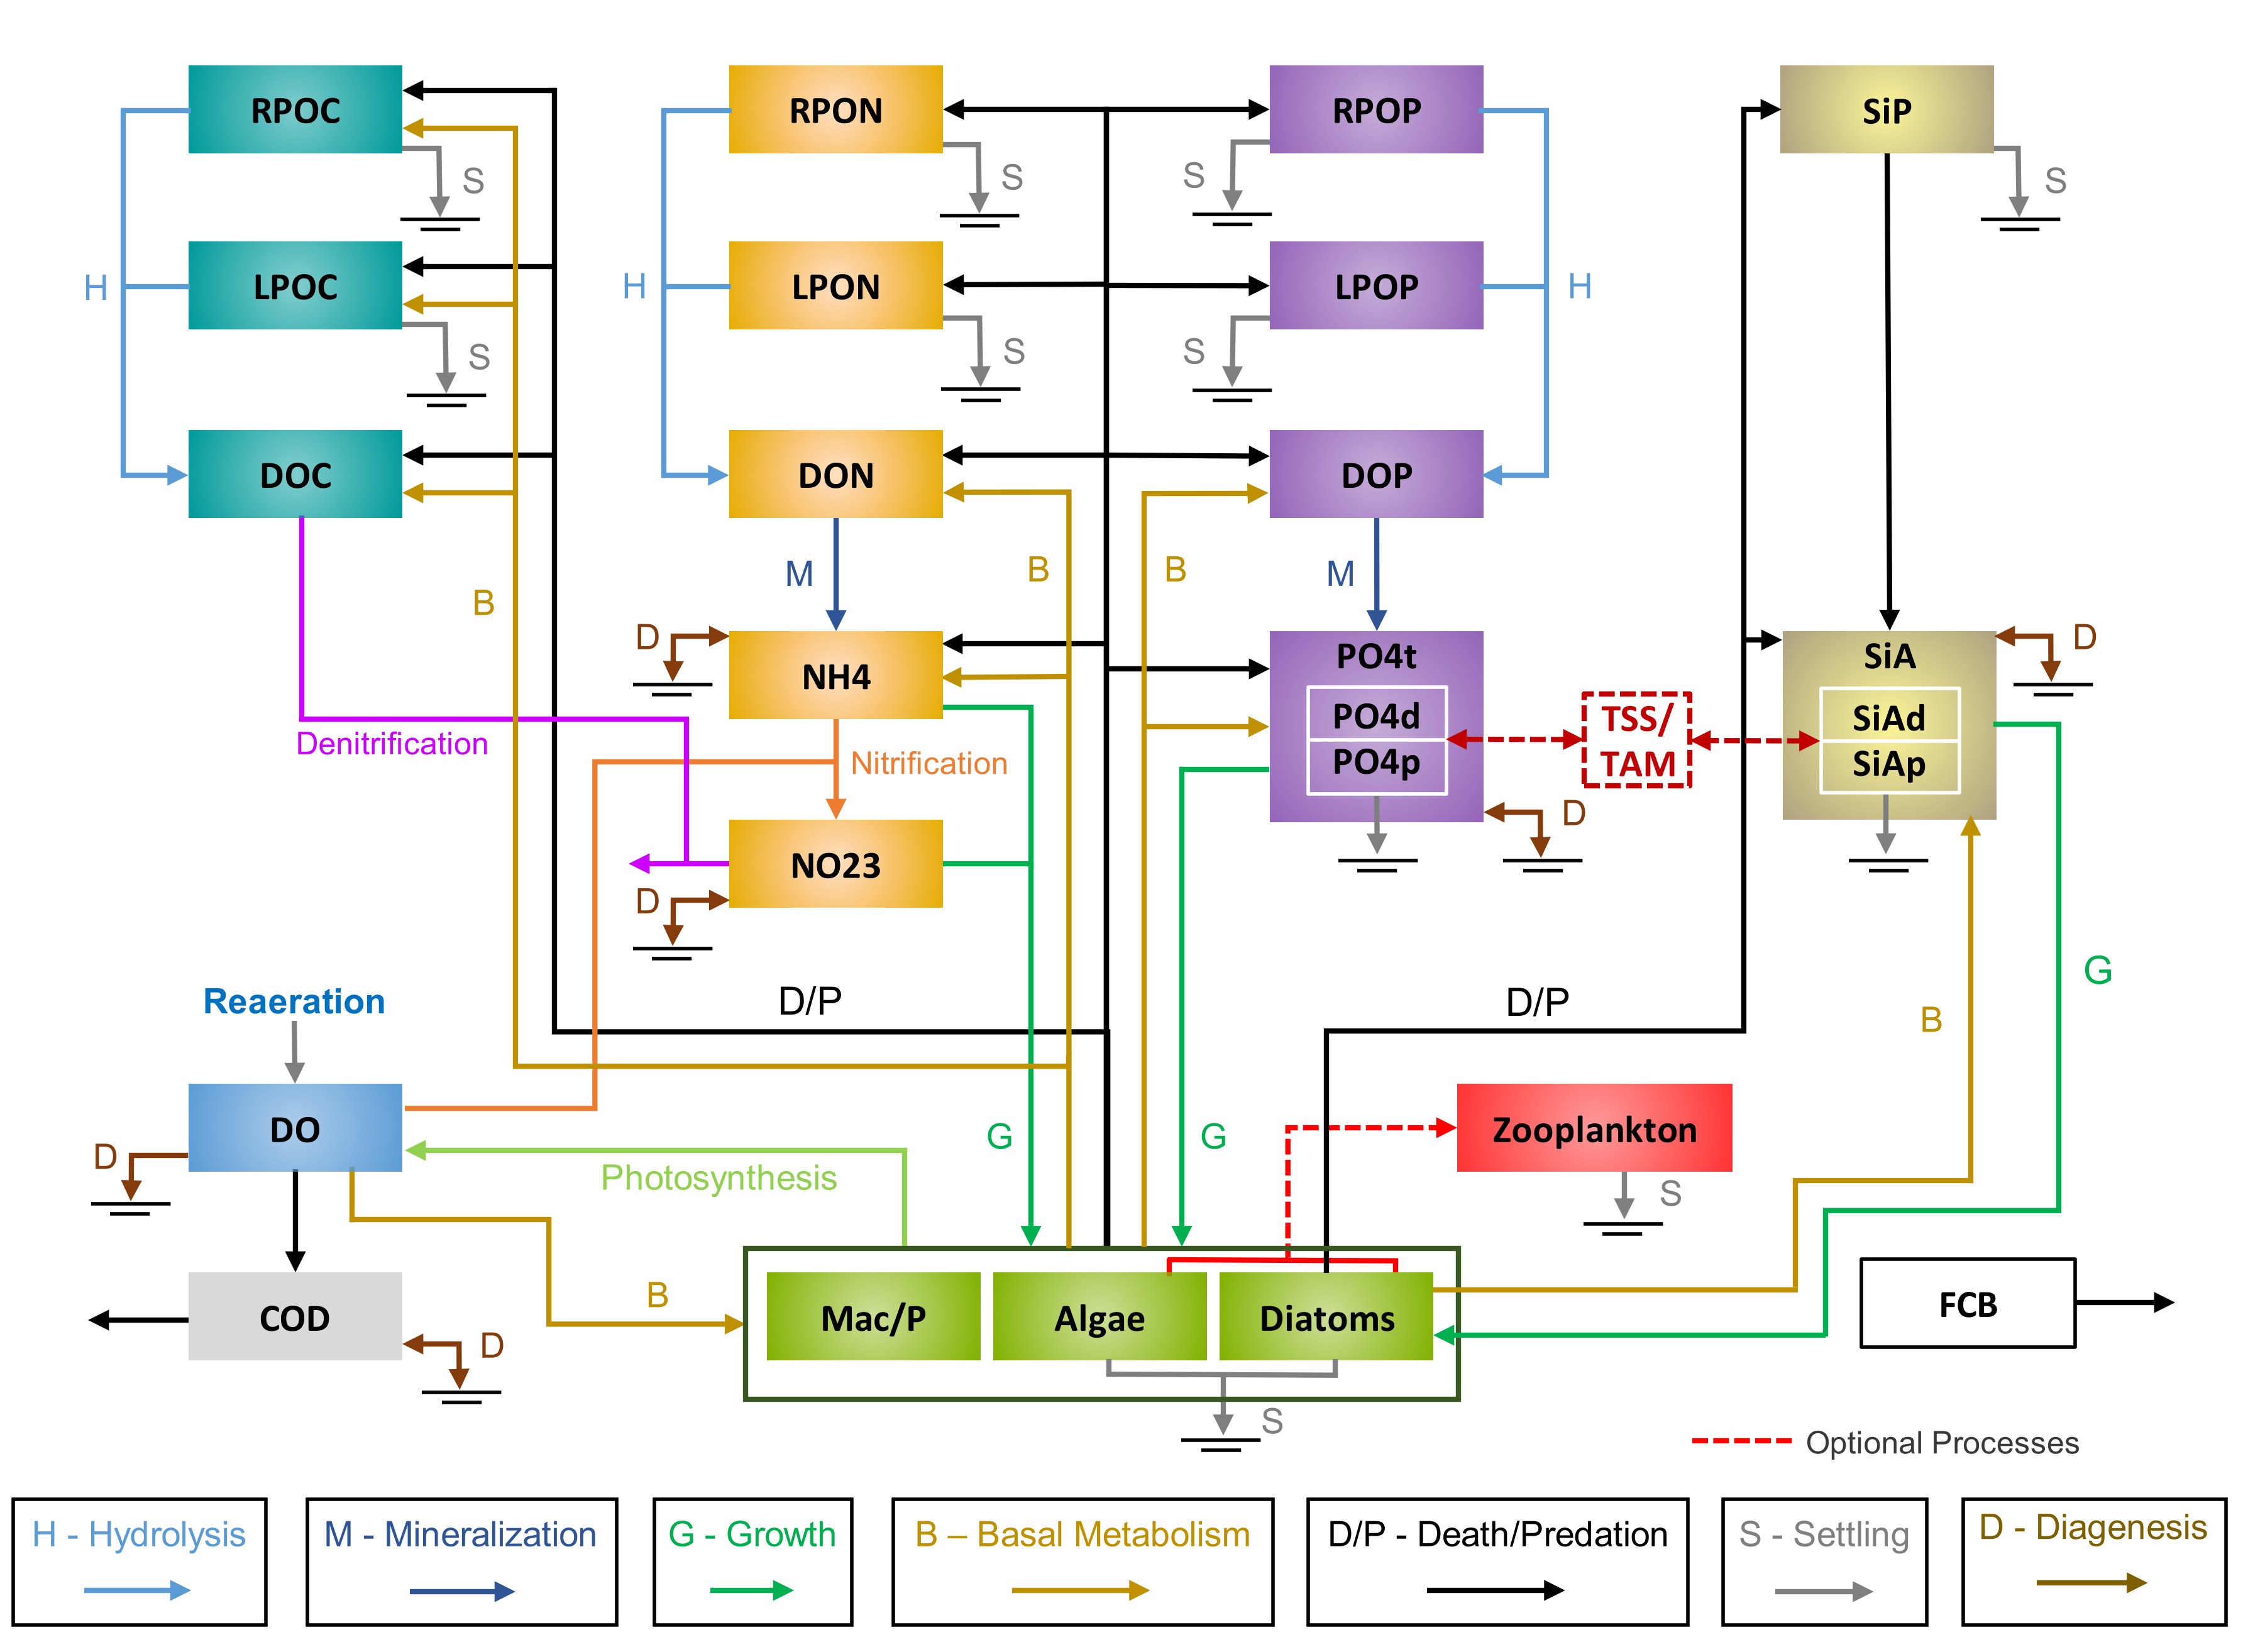
Figure 2 — State variables and the kinetic pathways between them. Individual processes — hydrolysis, mineralization, growth, basal metabolism, death and predation, settling, diagenesis — can be switched on or off.
Unlimited Algal and Macrophyte Groups
Legacy EFDC offered three free-floating groups including cyanobacteria, diatoms, and green algae plus one stationary macroalgae group. [EFDC+] From EFDC+ 10.3 onward you can define an unlimited number of algal, periphyton, and macrophyte groups, each with its own label, settling rate, half-saturation constants, and nutrient uptake rates.
Macrophyte groups use the same kinetics but aren’t transported, which makes them suitable for macroalgae, periphyton, and substrate-attached growth. [EFDC+] EFDC+ also allows macrophytes to grow between layers with their base in any layer, so floating macrophytes can start at the surface and drape down the water column, and macrophyte beds feed back into the hydrodynamics as physical resistance to flow.
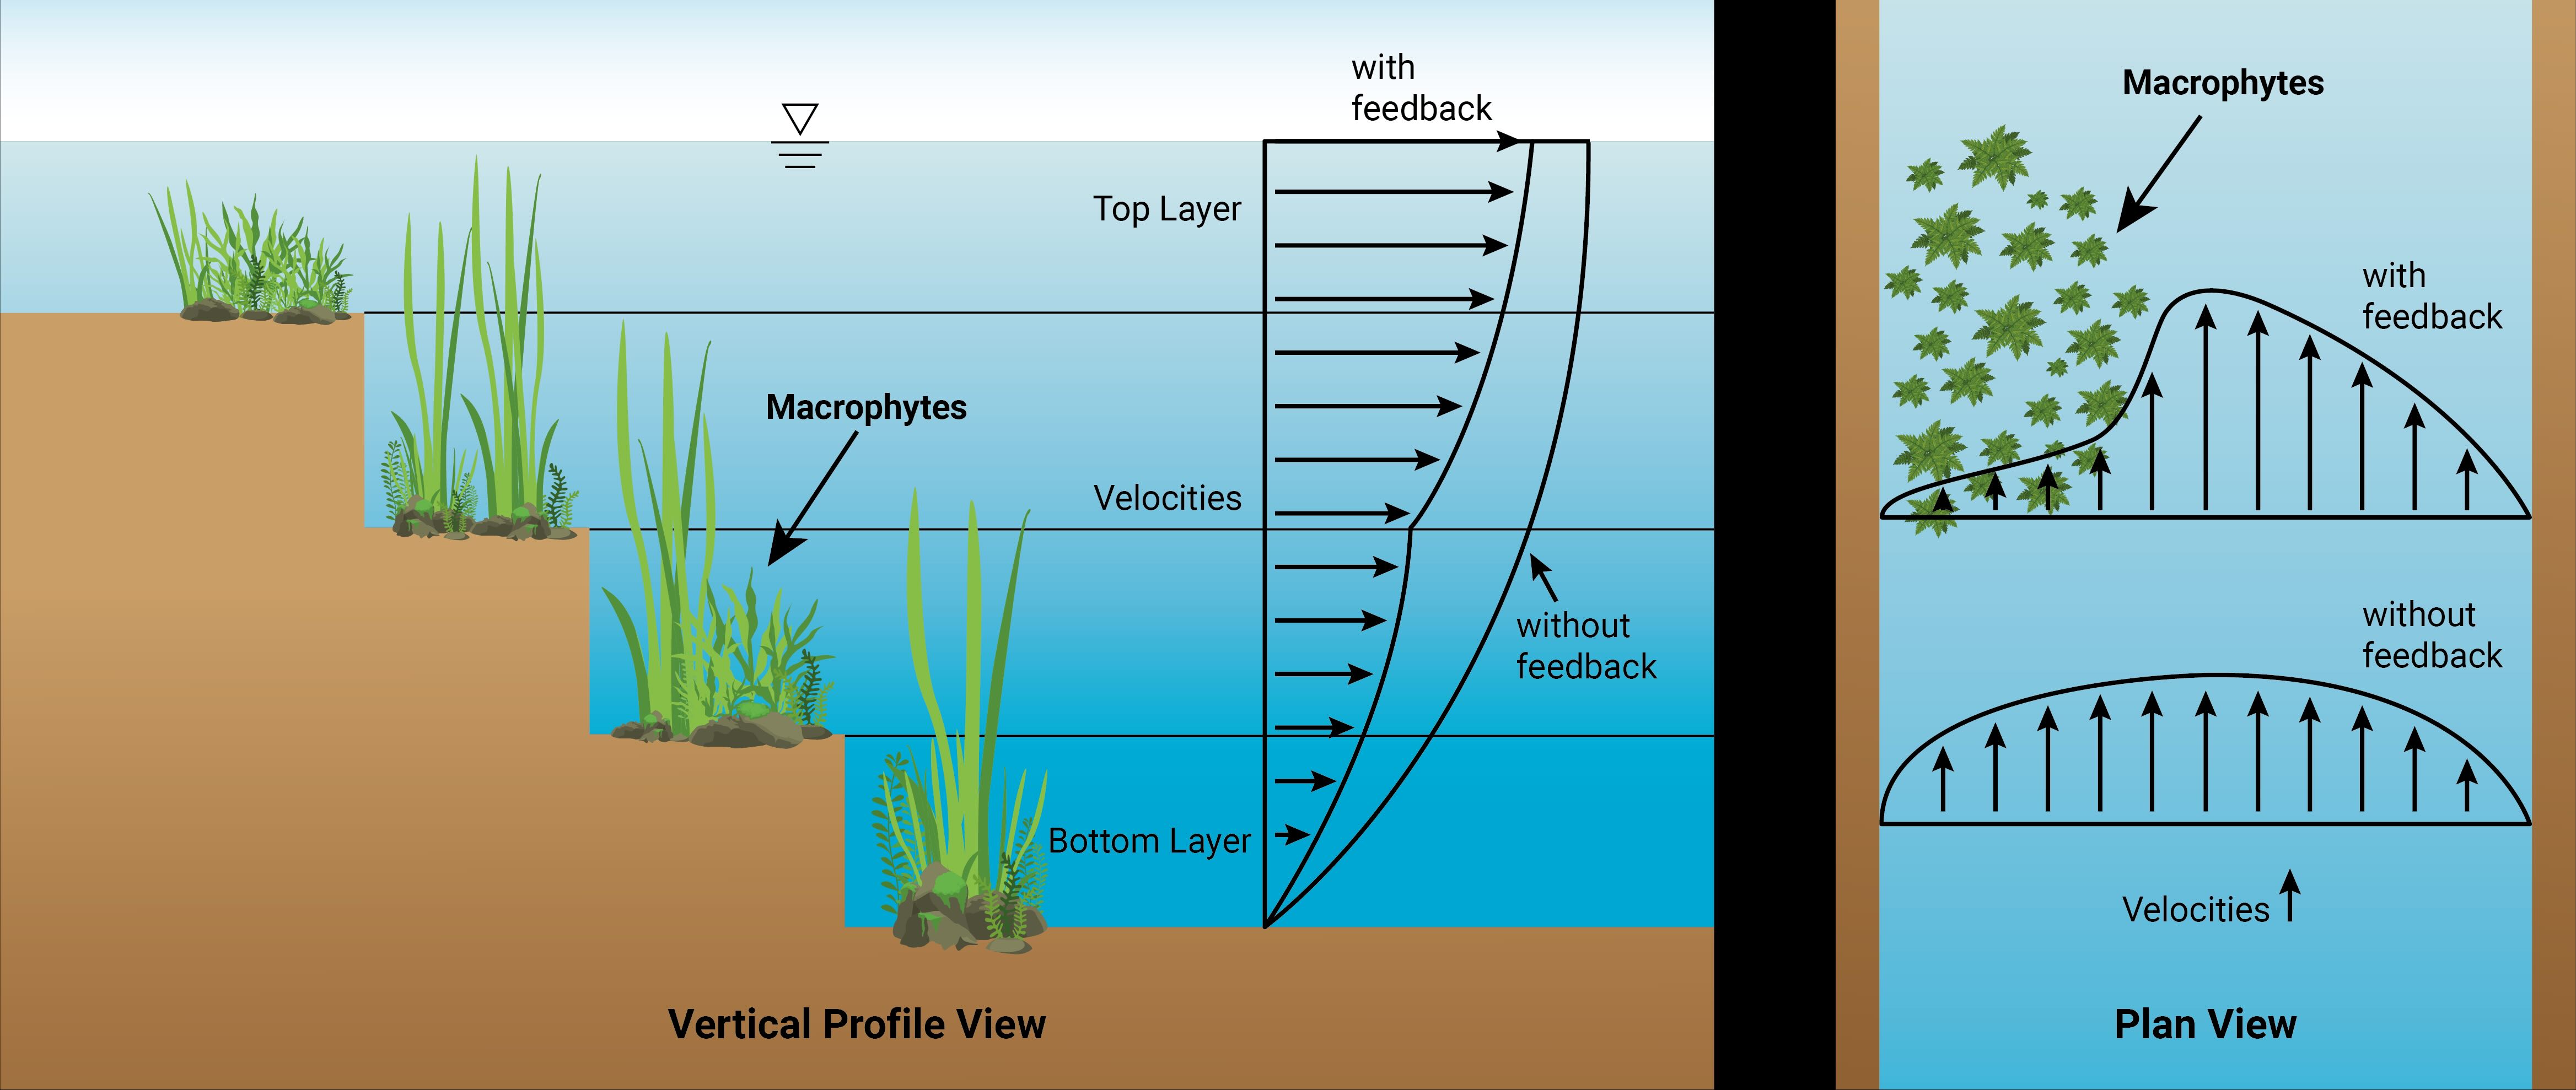
Figure 3 — a) Macrophytes grow in vertical columns from bottom upwards and its impact on flow velocity. b) Plan view of macrophyte’s impact on flow velocity
Algal Vertical Migration and HABs
Some cyanobacteria move vertically through the water column independent of the current, adjusting buoyancy as photosynthesis accumulates carbohydrates by day and consumes them at night. That daily cycle gives them alternating access to light near the surface and nutrients at depth and it is what produces the surface accumulations recognized as harmful algal blooms, which shade the water beneath and drive the oxygen depletion that kills fish.
[EFDC+] New in EFDC+ 12, the water quality module offers two ways to represent this: a predefined velocity model following Overman and Wells (2022), which imposes a daily migration cycle, and a dynamic velocity model, in which migration velocity responds to simulated conditions. Settling is handled alongside migration, since algae reaching the bed becomes a significant nutrient source feeding sediment diagenesis.
For more information on cyanobacteria vertical migration please visit Modeling of Cyanobacteria Vertical Migration and Vertical Migration of Cyanobacteria – Application to Lake Mendota blog posts.
Unlimited Zooplankton Groups
Zooplankton graze algae, bacteria, and organic carbon. Grazing can be the dominant algal loss mechanism depending on season, population, and grazing rate. [EFDC+] A zooplankton kinetics module was implemented in EFDC+ version 10.3, based on Cerco et al. (2004) and Seo (2019), and supports an unlimited number of groups defined through their kinetic parameters with growth, basal metabolism, mortality, and predation on zooplankton all represented.
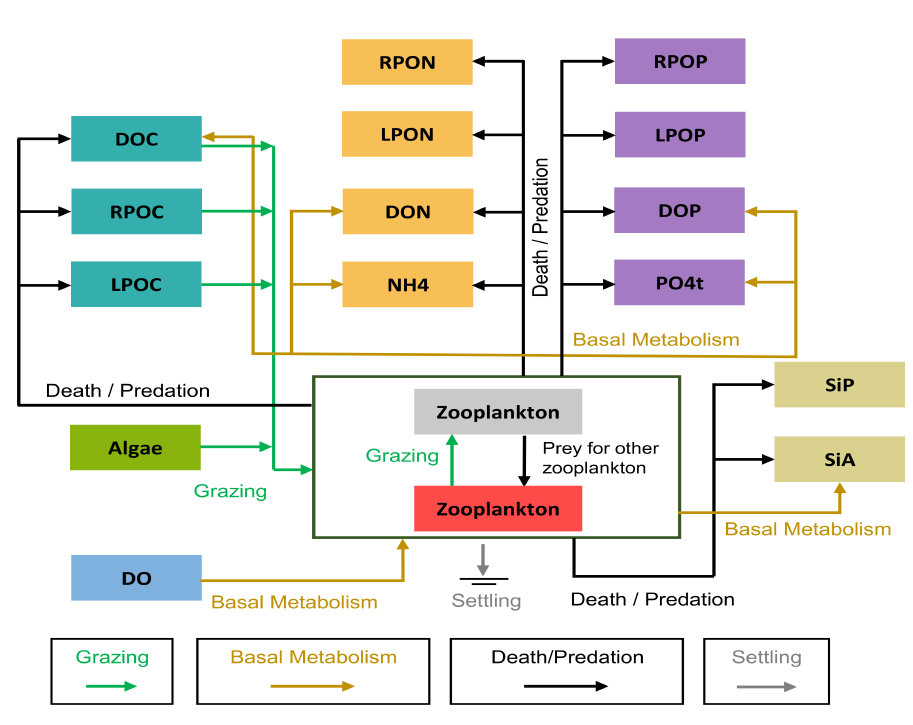
Figure 4 — Zooplankton kinetic diagram
Sediment Diagenesis
Long-term water quality responds to what the bed does with the nutrients it receives, so EFDC+ couples a sediment process model to the water quality model. Originally developed by DiToro for the Chesapeake Bay Model, it simulates twenty-seven state variables and predicts nutrient flux between sediment and water column.
It runs three linked processes. Particulate organic matter settles from the water column (depositional flux); within the bed it decays, producing oxygen demand and inorganic nutrients (diagenesis flux); and the products then leave the sediment (sediment flux), oxygen demand as SOD at the sediment-water interface, as COD exported upward, or buried to deep inactive sediment, with inorganic nutrients either released to the water column or buried. The bed is represented as a thin aerobic surface layer over a much thicker lower layer, which is what allows SOD and nutrient release to respond to overlying oxygen conditions rather than being prescribed.
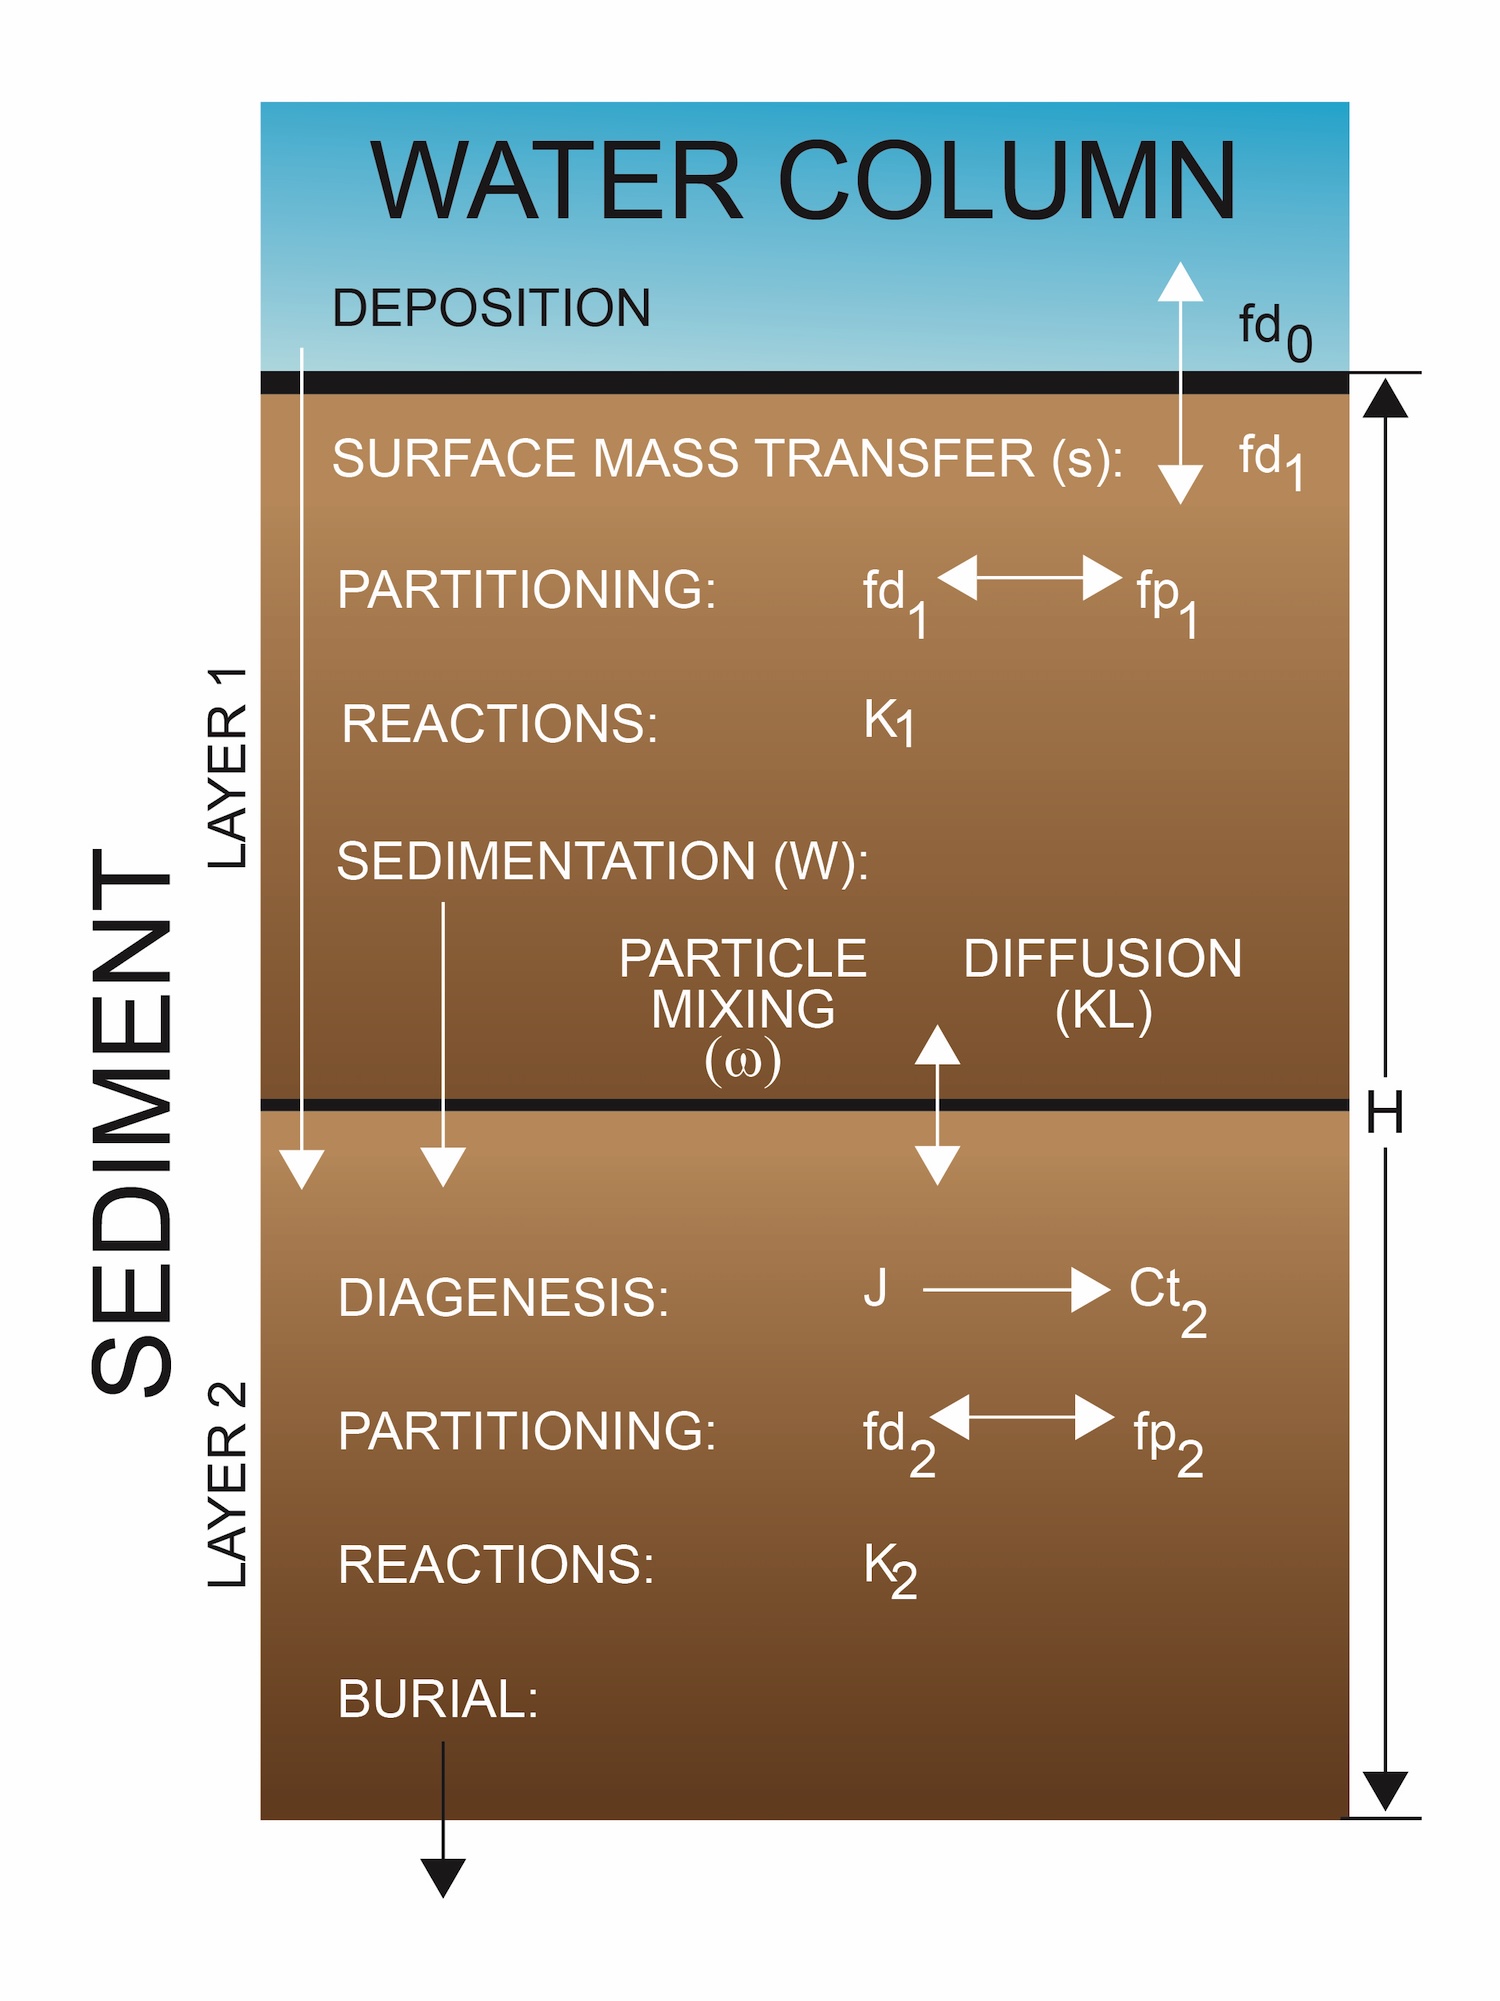
Figure 5 — Sediment layers and processes included in sediment diagenesis model
Aquatic Vegetation
The Rooted Plant and Epiphyte Module (RPEM) simulates submerged aquatic vegetation commonly observed along the banks of rivers and lakes, tracking four state variables: plant shoots, roots, epiphyte algae growing on the shoots, and shoot detritus. Growth responds to nutrients, carbon, oxygen, light, temperature, salinity, and plant density, with carbon transported between roots and shoots.
The interactions are individually switchable, simulate rooted plants alone, epiphytes alone, epiphytes on plants, RPEM linked to water column nutrients, RPEM linked to sediment diagenesis, or any combination. Parameters were developed against the Florida Bay seagrass model, with Thalassia and Halodule as dominant species.
Kinetic Time Step
Water quality kinetics evolve far more slowly than the hydrodynamic time step needs to be for stability. [EFDC+] EFDC+ therefore solves the kinetic equations over a user-specified multiple of the hydrodynamic time step, using a generalized trapezoidal scheme with a selectable implicitness factor, and runs sediment diagenesis on the same interval. You can refine the hydrodynamic time step without multiplying the cost of a 21-variable kinetic solution alongside it.
Acknowledgement
We would like to acknowledge the collaboration and contribution of professor Dongil Seo from Chungnam National University, South Korea in the improvement of the phytoplankton/zooplankton dynamics.